General Chart Options
The drawing options section of GetCHART consists of a set of folding panels, each of which is a set of options.
Some option sets are common to all types of charts, including Axis, Layout, and Description.
Axis
Axis are the axes of the chart. Axis can be configured in most charts, including Line Chart, Area Chart, Bar Chart, Scatter Chart, Candlestick Chart, etc. Axis options can configure coordinate columns, axis lines, ticks, etc.
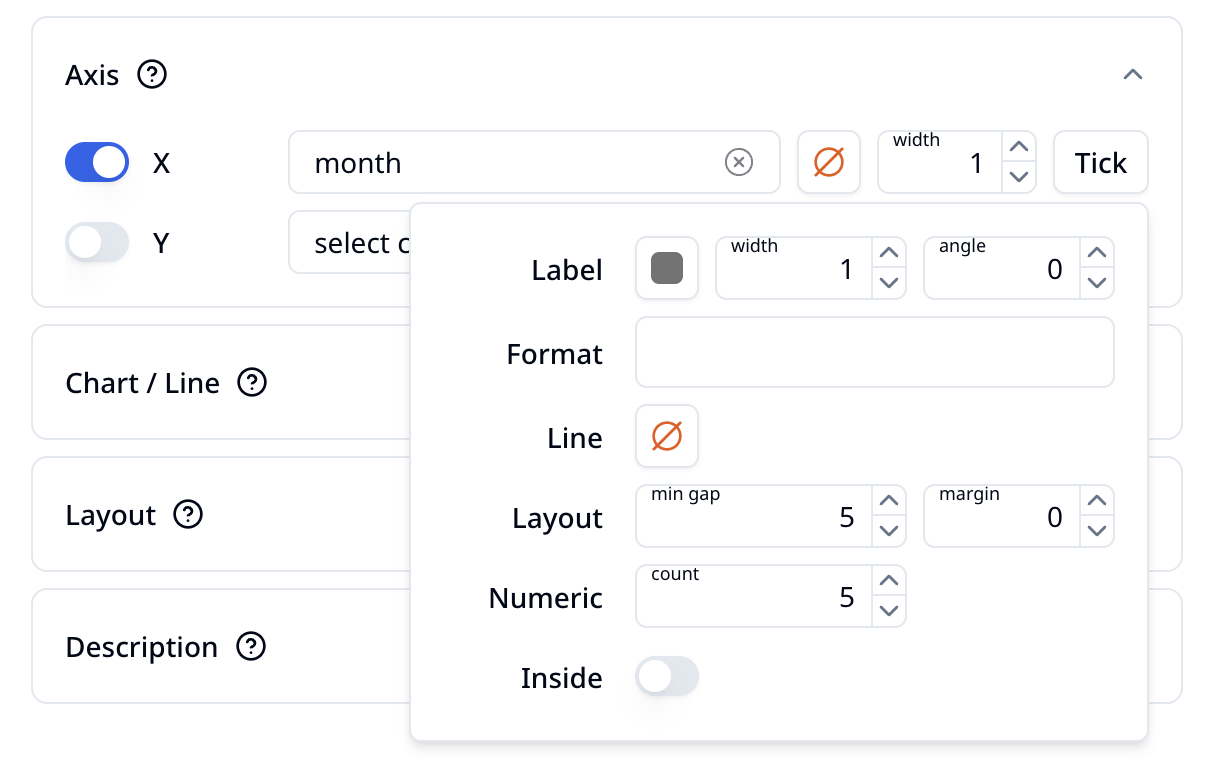
The axis option panel is as follows

Usually, there are two groups of axis options, namely X and Y. Taking X axis as an example, select a column to determine the scale value of the coordinate. If you do not need to display the axis, you can turn it off by clicking the switch button in the front. If you choose to display, you will see the axis in the chart preview box on the right.
Axis has a default configuration. By default, only the tick label is displayed. If you also want to display the axis line, you can use the color button to select a color to display; in addition, you can configure the thickness of the line.
The axis tick is configured in the "Tick" pop-up option box.

- Label: You can configure the label's color, font weight, and rotation angle (in degrees).
- Format: Similar to Excel formulas, such as
left(3)to truncate the label to the first three characters. - Line: The color, thickness, and length of the tick marks.
- Layout: The minimum gap between ticks, and the margin between tick marks and labels.
- Numeric: When the ticks are numbers, the number of ticks to display.
- Inside: When this option is selected, the ticks are displayed inside the axis line.
Layout
Layout defines some overall styles of the chart drawing part.

- Margin: The top, bottom, left, and right margins of the chart drawing part.
- Grid: The grid lines of the chart drawing part. You can choose to draw horizontal and vertical grid lines separately.
- Orientation: The direction of drawing. The default is horizontal drawing. For Bar Chart, you can choose to draw vertically.
- Stack: The stacking method of multiple drawing objects, used for Area Chart, Bar Chart, etc. If you choose stacking, you can try the "expand" mode.
Description
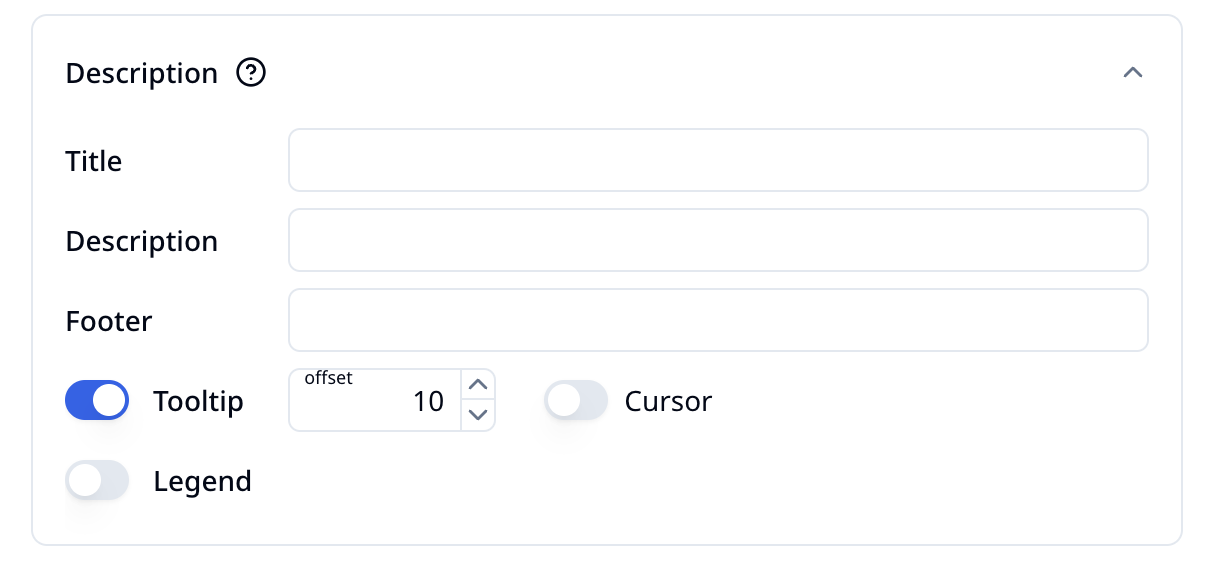
Description can configure some styles and content outside the chart drawing part.

- Title: Define the title of the chart.
- Description: Define the description of the chart, which is displayed below the title.
- Footer: Define the bottom text of the chart.
- Tooltip: The tooltip box is used to display the value and other information of a specific object on the chart. When the mouse moves to an object on the chart, a floating box will pop up.
- Legend: Shows the correspondence between the colors and data column names in the chart, usually displayed at the bottom of the chart drawing part.