Get CHART
The simplest no-code diagramming tool.
Charts are a way to visually display data and gain insights into data. When we need to analyze data changes and understand data trends, we often use charts.
GetCHART uses a simple and easy-to-understand interactive form to draw dynamic charts, without any code, and provides a large number of reusable examples. You can understand your data directly through charts on our website, or download charts and use them elsewhere.
Features
Simple and intuitive UI interaction, no code required
Unlike other tools that draw charts through scripts, GetCHART controls the generation of charts through UI options, and uses a very simple UI design, which is intuitive and easy to understand.
Dynamic rendering
Any change in options will directly render the results, allowing you to see the results without wasting time.
Abundant examples
If you are unsure about the style of drawing a chart, you can refer to the chart style in the examples; or if you don’t want to spend time understanding UI options, you can also use them directly, replace the data, and generate charts without configuration.
Getting Started
First, you need to prepare the data.
GetCHART supports data sources such as CSV/Excel files from local or network URLs, or directly input in the text box.
Upload or input data through the component box below:

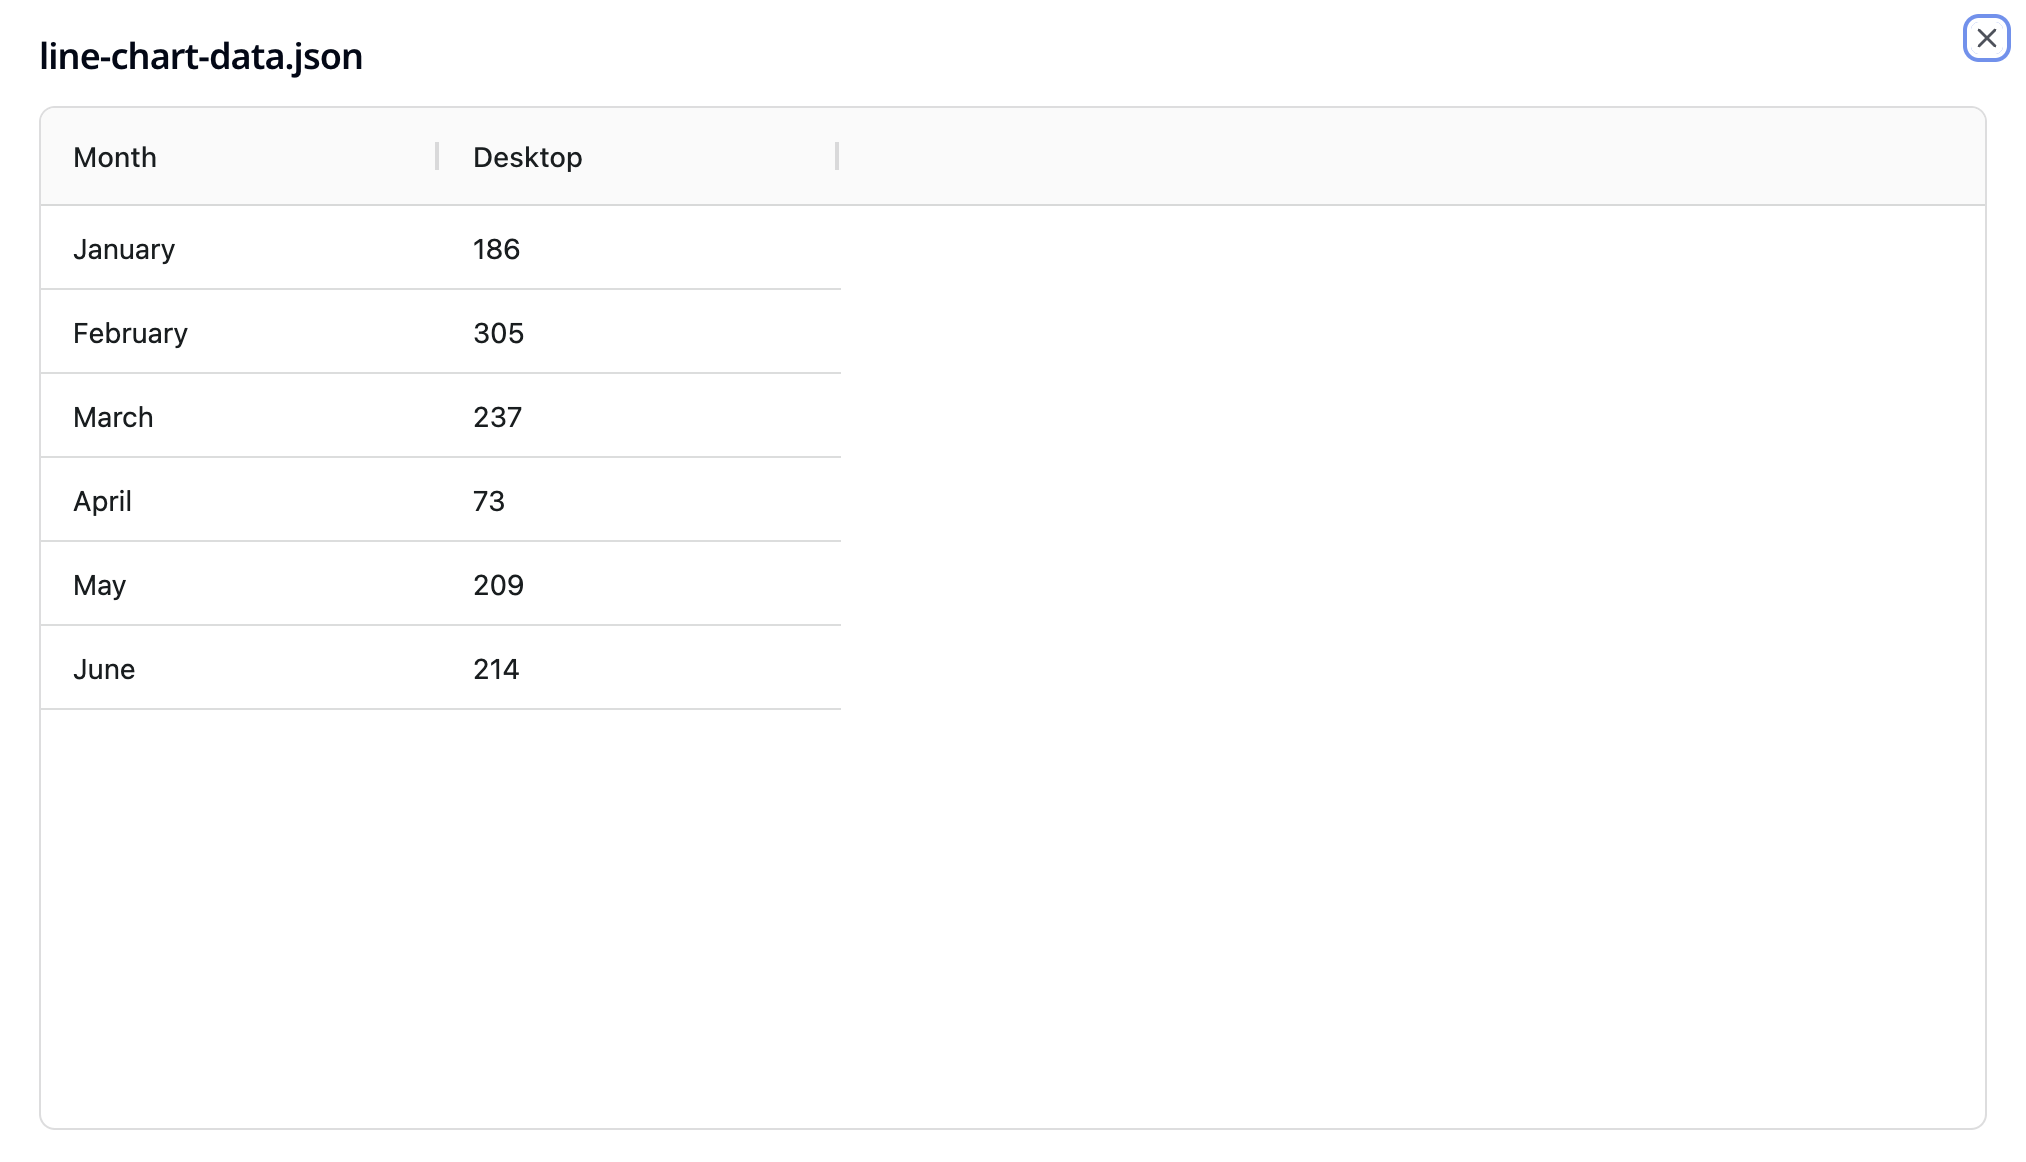
After entering the data, you can click on the data bar to view the content of the data.

Now, you can draw the chart.
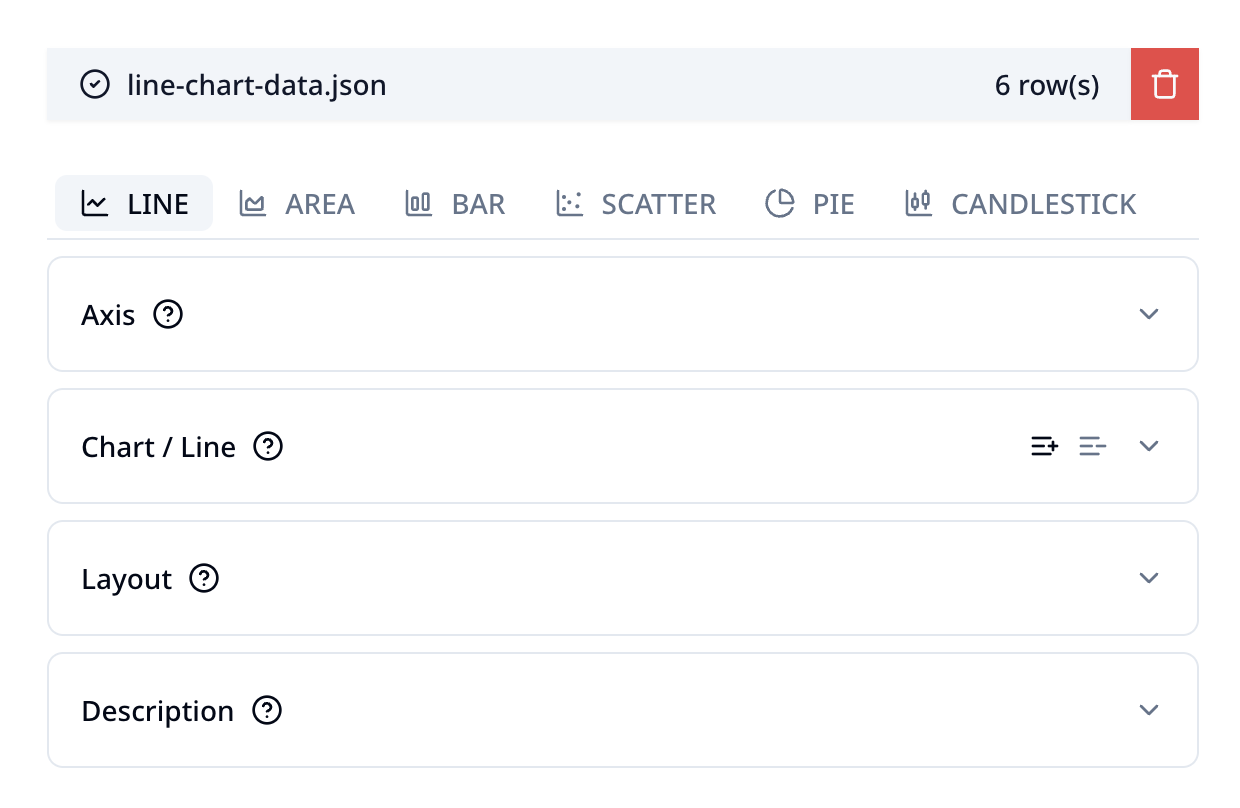
Drawing a chart is done through the options panel like this

GetCHART supports a range of chart styles, including line charts, area charts, bar charts, dot charts, pie charts, candlestick charts, etc. More styles are being supported. Each style is controlled by a series of similar options. Therefore, you can directly draw the chart by modifying the values of these options.
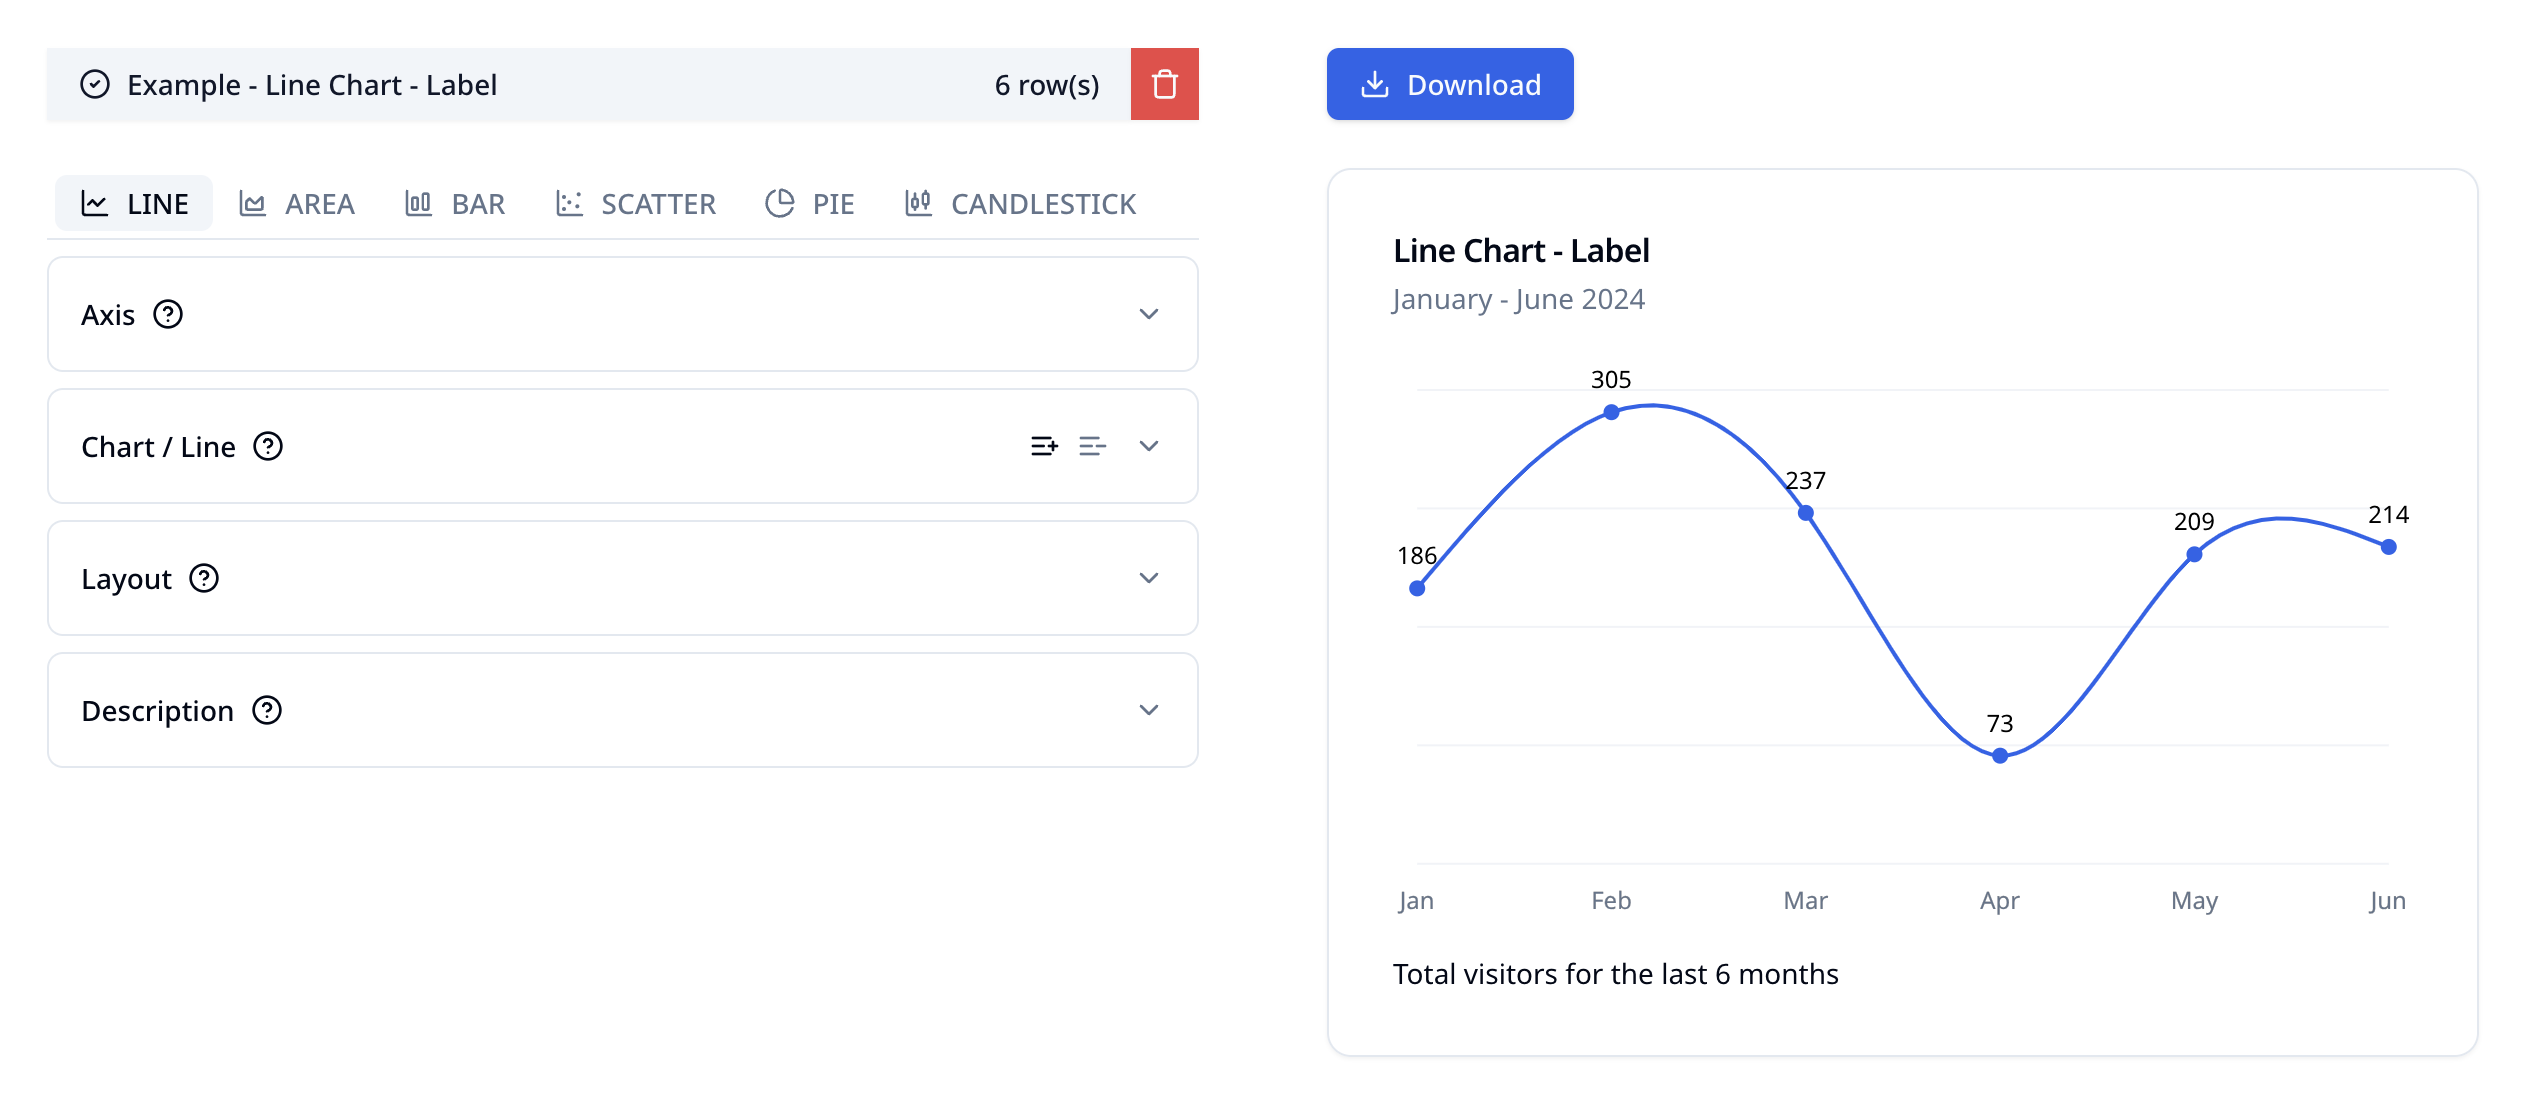
A simpler way is to check the examples and find a similar chart that you expect. Click "Edit" and then directly replace the data on the opened page to complete the preliminary drawing.
For example, we use the "Line Chart - Label" example

Based on this, you can adjust some options to achieve the desired effect.
Next step
Please refer to other documents to understand the usage of various chart styles and their options.